Searchable episodes

Ship It Weekly Transcripts

Transcripts make the show skimmable: search for a tool, an incident pattern, or a quote without scrubbing audio. Each block below shows the full episode transcript inline — scroll to read, or open the episode page for audio, chapters, and show notes.

Transcript coverage grows as episodes publish. Older episodes sync from the RSS feed on the next import; check back after a new episode drops if one is missing.

What this page is for

Why transcripts matter

Operators search for specifics — a CVE, a Terraform pattern, an on-call habit — and transcripts let you land on the right episode fast.

Read inline or on the episode page

This archive shows full transcript text for browsing and search. Open any episode for the interactive player, timestamp sync, chapters, and show notes.

Written companion

For weekly written DevOps/SRE news, pair the podcast with On Call Brief — the sister briefing at tellerstech.com. On Call Brief news →

Read episode transcripts

PeopleSoft gets hit by a zero-day. Npm changes what code is allowed to run during install. GitHub removes long-lived personal access tokens from agentic workflows. And Anthropic reminds everyone that your AI dependency can disappear for reasons that have nothing to do with uptime. The theme this week is simple. Default trust is getting punished. Old enterprise systems were trusted. Because they were internal.

Package installs were trusted because that is just how the ecosystem worked. CI/CD tokens were trusted because they were convenient. AI models were trusted because the API worked yesterday. But production does not care why you trusted something. It only cares what that trust was allowed to do. I'm Brian Teller from Teller's Tech, and this is Ship It Weekly.

Welcome back to Ship It Weekly, the show where we look at the DevOps, SRE, cloud, platform, and security stories that actually matter when you are the person who eventually has to keep the thing running. This week is about default trust. We're starting with Oracle PeopleSoft and a zero-day that was reportedly exploited before Oracle released an emergency patch. Then we'll talk npm v12.

Changing install-script defaults which is great for supply-chain security and maybe a little annoying for some CI pipelines after that we'll get into github agentic workflows no longer needing personal access tokens which is the kind of boring credential change that actually matters then we'll talk about Anthropic disabling fable 5 and mythos 5 after a us export control directive because AI model availability is now also a policy-risk dependency.

In the lightning round, we'll hit Tekton CloudEvents moving to a dedicated events controller, NVIDIA Triton 26.04 changing inference server defaults, AWS Nitro Isolation Engine using formal verification, and Homebrew 6.0 requiring explicit trust for third-party taps. The human closer this week is about trust defaults, because a lot of incidents start with one quiet assumption. The system is internal.

The package is fine. This token is safe. This model will be there tomorrow. And sometimes that assumption is the real production dependency. So let's get into it. Oracle issued an emergency advisory for CVE-2026-35273 in PeopleSoft PeopleTools. And yes, I know, PeopleSoft does not sound like the kind of shiny cloud-native story that makes people sprint to the podcast app. But that is exactly why it matters.

A lot of modern companies still depend on older enterprise systems for HR, finance, payroll, student records, supply-chain. And all the boring data that becomes extremely exciting when attackers get it. Oracle says that the vulnerability is remotely exploitable without authentication and can result in remote code execution.

Public reporting says exploitation was observed before Oracle's emergency advisory, with ShinyHunters linked activity targeting mostly U.S. Organizations, especially higher education. So the shape of the story is pretty clear. Old enterprise application, sensitive data, remote unauthenticated exploit, active exploitation, emergency patch. That is a bad combination.

And the lesson for DevOps, SRE, platform, and cloud teams is not just patch PeopleSoft. Although, yes, obviously, patch PeopleSoft. The bigger lesson... Is that the enterprise app tier is still part of your perimeter, even if everyone emotionally moved on to Kubernetes. A lot of teams have a weird relationship with older enterprise platforms.

They are important enough that nobody can turn them off, but old enough that nobody really wants to own them. They live in a special network zone. They have a special upgrade window. They have special vendor requirements. They have special firewall rules. From 2017 that everyone is afraid to touch. And somehow, because they are enterprise apps, people stop thinking of them like internet-exposed production systems.

Attackers do not care what generation of architecture the system belongs to. They care whether it has data, access, and a path in. PeopleSoft may not be the cool part of your stack, but if it holds HR data, finance data, student data, employee data, or business workflow data, it is very much part of your attack surface. This is also a good reminder that legacy does not mean low-priority.

Sometimes legacy means high-value, hard-to-patch, badly isolated, and full of data. That is not low-priority. That is where an attacker brings a shovel. The practical takeaway is simple. Know where these systems are. Know whether they are internet exposed. Know who owns patching. Know who owns logs. Know what normal access looks like.

Know whether unusual agents, web shells, or scheduled tasks would actually be noticed. And if you are a platform or cloud team that thinks this is someone else's problem, be careful. Because during the incident call, someone else's problem has a funny way of becoming why did nobody know this existed. Your ERP systems, HR systems, finance systems, and admin portals are production systems. Treat them that way.

Second story. Npm v12 is changing some defaults around install scripts. And this one matters to developers, platform teams, CI maintainers, security teams, and anyone who has ever watched an npm install do 12 things they did not explicitly ask it to do. GitHub says npm v12 is expected in July 2026. And one of the big breaking changes is that allowScripts will default to off.

That means npm install will no longer execute pre -install, install, or postinstall-scripts from dependencies unless they are explicitly allowed. Prepare scripts from git, file, and link dependencies are blocked the same way. These settings are already available in npm 11.16.0 for migration testing. This is a big ecosystem shift. For years, npm install has been more powerful than people like to admit.

You run the package install. The package runs code. That code might build native bindings, download binaries, generate files. Patch something, bootstrap something, do the magic that makes everything work. But that same install-time execution path is also a supply chain attack surface. A malicious package does not need your app to import it at runtime if it can run code during install.

It only needs to land in the dependency tree. Then the CI runner, developer laptop, or build machine does the rest. This is why this change matters. It moves the ecosystem from implicit trust towards explicit trust. And yes, that is good. But some builds are going to break. Because a lot of pipelines have been relying on install-time magic without documenting it. Native modules. Post install downloads.

Git dependencies. File dependencies. Link dependencies. Internal packages. Packages that compile. Packages that generate code. Packages that do one tiny little install step that nobody has looked at since the person who wrote it left the company. Those assumptions are about to become visible. And visibility is great. Right after it ruins your Tuesday. The practical takeaway is not panic about npm v12.

The takeaway is to test early. Run builds with the new behavior before it becomes the default. Find which dependencies need scripts. Decide which scripts you actually trust. Document why. And do not just flip everything back on because one pipeline failed. That defeats the point. This is a chance to clean up dependency trust, especially in CI. Ask what install-scripts run today.

Ask whether CI runners have secrets available during install. Ask whether build steps can reach internal services. Ask whether developers are running installs on machines with cloud credentials, SSH keys, or package publishing rights. Because the blast radius of an install-script is not just the package. It is whatever the install environment can access. I like this change.

It is going to annoy people, but sometimes the annoying default is the correct default. Npm install is finally getting less magical. And that means that some teams are about to discover how much magic they were depending on. Third story. GitHub says agentic workflows no longer need a personal access token. And yes, that sounds boring. But boring credential changes are often the ones that save you later.

Previously, agentic workflows needed personal access tokens in certain setups. Now GitHub says, These workflows can use the built-in GITHUB_TOKEN and the copilot request write permission instead. The point is to avoid creating and storing long-lived personal access tokens for agentic workflows. This matters because agentic CI/CD is already risky enough.

These workflows can read context, generate changes, open pull requests, review code, call tools, interact with repo state, and eventually, in some environments, they may become part of release, remediation, triage, or automation paths. So the credentials they use matter a lot. A personal access token is often tied to a person. It may be long-lived. It may have broad permissions. It may sit in secrets.

It may get copied between repos. It may survive longer than anyone intended. It may still exist after the workflow changed, the person changed teams, or everyone forgot. Why the token was created. That is not a great pattern for agentic automation. A scoped workflow token is not magic. You still have to configure it correctly. You still have to review permissions.

You still have to think about which events can trigger the workflow. You still have to worry about untrusted input. But it is a better default than handing an agent a long-lived personal credential and hoping everyone remembers where it lives. The platform takeaway is simple. If you are experimenting with agentic workflows in GitHub, review the whole trust model. What repos can run it? What events can trigger them?

What permissions do they get? Can pull request content influence the agent? Can issue comments influence the agent? Can the agent write code? Can it approve changes? Can it call external tools? Can it see secrets? Can it publish artifacts? Can it affect production? And are you still using personal access tokens where you do not need them? Because agents are not just assistants once they enter CI/CD.

They become automation services. And automation surfaces need boring, strict, reviewable credentials. So yes, use the better GitHub auth model. But do not stop there. If it can change code, trigger work, or spend money, it belongs in your production automation threat model. Fourth story. Anthropic published a statement saying that the U.S.

Government issued an export-control directive requiring Anthropic to suspend access to Fable 5 and Mythos 5 by any foreign national, whether inside or outside the United States, including foreign national Anthropic employees. Anthropic said that the net effect was that it had to abruptly disable Fable 5 and Mythos 5 for all customers. To ensure compliance. Access to other Anthropic models was not affected.

Now, this is not a normal SRE outage. There was not a regional failure. There was not a bad deploy. There was not a database incident. There was not a capacity problem. But for customers who depend on those models, the effect is still operational. The dependency disappeared. And it disappeared for policy reasons. That is the lesson.

If AI APIs are part of your production path, dependency risk is no longer just uptime, latency, quota, and cost. It is also model availability, geography, export-controls, regulatory shifts, vendor policy, safety policy, commercial access, model deprecation, compliance interpretation, and whatever new category we invent next quarter.

This is uncomfortable because AI dependencies can be harder to substitute than people pretend. You can usually swap one HTTP endpoint for another at a code level. But can you swap the behavior, the context window, the latency, the tool calling behavior, the moderation behavior, the cost profile, the prompt format, the eval results, the customer experience, the internal workflow?

The fallback may not be use a different model. The fallback may be a degraded mode, a smaller model, a cached response, a human review queue, a simpler workflow, a feature flag, a regional restriction, or a message that says this capability is temporarily unavailable. Boring fallback behavior is better than waking up to discover your product path depends on a model that is no longer available to you.

The practical takeaway is to add AI models to your dependency register like any other production dependency. Track which features use which model. Track whether the model is in a critical path. Track where your users are. Track fallback options. Track whether you can degrade gracefully. Track whether a vendor-side access change would be an incident. And test the fallback. Do not just write...

Fall back to another model in a doc and call it done. Actually try it. Because the weird thing about AI infrastructure is that even when the API shape looks portable, the behavior is not. Your AI dependency can disappear for reasons that have nothing to do with uptime. That means your reliability plan needs to cover more than outages. Now let's do a quick lightning round.

First, Tekton pipelines changed how cloud events are sent. Cloud events for PipelineRuns and TaskRuns now move through a dedicated Tekton events controller instead of the core pipeline run and task run controllers. That means operators need to make sure the tekton-events-controller deployment is actually running. Small looking platform changes like this can have real operational impact.

If CI/CD observability, event routing, notifications, or automation depends on Tekton events, make sure the new controller is deployed, monitored, and part of the upgrade checklist. Because the pipeline ran, but the event never showed up, is exactly the kind of thing that sends teams into Slack archaeology. Second, NVIDIA Triton Inference Server 26.04 has changes operators should read before upgrading.

Client shared memory is now disabled by default and must be enabled explicitly if you rely on the old behavior. Triton also enforces max inflight requests as a shared limit across ensemble requests, which is meant to prevent unbounded queue growth in ensemble pipelines. The short version is this. AI inference servers are now normal platform infrastructure. Defaults change.

Queue behavior changes, memory behavior changes, model control changes. So upgrade them like production systems, not sidecar experiments. Third, AWS published a deep dive on the Nitro Isolation Engine. AWS says the Nitro Isolation Engine is generally available on Graviton5-based instances and uses formal verification to demonstrate isolation properties.

That is interesting because cloud isolation is usually something customers trust, but cannot directly inspect. Formal verification does not mean bugs are impossible, but it does show where cloud providers are heading. Smaller trusted components, tighter isolation boundaries, and mathematically checked properties for the parts that protect customer workloads. Fourth, Homebrew 6.0 introduced tap trust.

Homebrew now requires explicit trust. For third-party taps before evaluating or running their Ruby code, while official taps remain trusted by default. This is another supply-chain default, changing from sure, run it, to are you sure you trust this? And that is good. A third-party tap can contain arbitrary Ruby.

If your developer laptops, CI runners, or bootstrap scripts use Homebrew, This change is worth knowing about. Some installs may prompt or fail until trust is explicit. That might annoy people. But again, that is the point. Developer tooling is part of the supply-chain. And fewer things should get to run code just because they were convenient. The human closer this week is about default trust.

PeopleSoft was trusted because it was an enterprise system that had been around forever. Npm install was trusted because package managers have always done some magic. Agentic workflows were trusted with personal tokens because that was the easy path. AI models were trusted because the API was available yesterday. Tekton events were trusted to keep flowing. Triton defaults were trusted until they changed.

Cloud isolation was trusted because that is the cloud model. Homebrew taps were trusted because developer tooling has historically been pretty casual about running code. Different stories, same pattern. Production risk often hides inside the trust defaults nobody has revisited. The system is internal. The install-script is normal. The token is convenient. The model will be available.

The event will fire the tap is probably fine those assumptions may be true until they are not so the practical question this week is simple what are you trusting by default which enterprise apps are still exposed which package installs run code in ci which agents still use long-lived tokens which ai models sit in production paths which developer tools can execute code before anyone reviews it that is platform work now not just building the shiny new thing but revisiting the old trust assumptions before attackers vendors regulators or outages revisit them for you find the defaults then decide whether they still deserve your trust That's it for this week of Ship It Weekly.

We covered the Oracle PeopleSoft zero-day, npm v12 install-script changes, GitHub agentic workflows moving away from personal access tokens, Anthropic's Fable and Mythos model suspension, and a lightning round on Tekton, NVIDIA Triton, AWS Nitro Isolation Engine, and Homebrew 6.0 tap trust. If this episode was useful, follow or subscribe wherever you are watching or listening. If you are on YouTube, hit subscribe.

If you're in a podcast app, follow the show there. And if you know someone dealing with enterprise app security, CI/CD supply-chain risk, agentic workflows, AI dependency planning, or developer tool trust, send this one to them. It helps the show grow, and it helps me keep making this kind of content for people who actually live with these systems.

You can find the weekly brief at OnCallBrief.com, and more episodes and show notes at shipitweekly.fm. I'm Brian Teller from Teller's Tech. Thanks for listening. And remember, production does not care why you trusted the default. It only cares what that default was allowed to do.

Scroll inside the box to read the full transcript.

AI is making it easier than ever to create more software, more code, more diffs, more experiments, more changes moving through systems that were already complicated before everybody got a robot assistant in the editor. And that sounds great until you are the team responsible for production because production does not really care that the code was generated faster. It still cares about latency.

It still cares about overload. It still cares about dependencies, rollbacks, traffic routing, region failures, weird edge cases, and whether the people on call actually know what to do when the system starts acting strange. That is the part of the AI conversation that feels under-discussed to me. Not just can AI write code, it can. Not just can AI help debug, sometimes yes.

The better question is what happens to reliability when the volume of change goes up, the amount of generated code goes up and the context behind that code gets thinner. Because incidents are not just caused by bad code. They are caused by systems behaving in ways people did not expect, under conditions they did not practice, with dependencies they forgot were part of the critical path.

That is really what this conversation is about. Not just SLOs, not just incident reviews, not just AI agents. More like, what does reliability actually look like when change is accelerating? Systems are more connected, and recovery matters just as much as prevention. I'm Brian Teller from Teller's Tech, and this is Ship It Weekly.

Welcome back to Ship It Weekly, where I filter the noise and focus on what actually matters when you are the one running infrastructure and owning reliability. Most weeks, it's a quick news recap. In between those, I do conversation episodes with people who are building platforms, running infrastructure, organizing events, and thinking through where this industry is actually headed.

Today is one of those conversations. I'm joined by Francois Richard, an engineering director at Meta. We're talking about reliability at scale, how AI and automation are changing production risk, what teams actually learn from incidents, and why recovery practice matters just as much as prevention.

And I like this conversation because it gets past the neat, clean version of reliability that fits nicely in a dashboard. Reliability is not just a number. SLOs matter, dashboards matter, alerts matter, guardrails matter. But none of that means much if the team cannot use it to make better decisions, recover from real failures, and improve the system after something breaks. You start with the obvious goal.

Keep the system up. Keep the users happy. Avoid incidents. Do not page people for nonsense. Do not let every deployment feel like a coin flip. Then reality shows up. A region has problems. A dependency gets slow. A service gets overloaded and cannot restart because it is too overloaded to recover cleanly. Traffic spikes during a major event. A change rolls out faster than the team understands it.

Or an AI-generated pile of code technically works until it fails in a way nobody has enough context to explain quickly. And somewhere in the middle of that, reliability stops being just prevention and starts becoming practice. In this conversation, Francois and I talk about how Meta thinks about reliability across both reactive and proactive sides.

Incident response, incident reviews, SLOs, guardrails, validation, disaster recovery testing and what happens when you actually practice taking a region out instead of just assuming the failover plan works because the diagram looks good.

We also get into what teams learn during incidentsss, not just from the post postmortem afterward but inside the pressure cooker itself where engineers have to make decisions quickly build consensus fast understand the system under stress and figure out what is actually happening while the clock is running there is also a good thread in here around AI agents in incident response not the fantasy version where you hand production to an agent and hope it saves the day more the practical version where AI helps with investigation telemetry metrics logs relationships across services and narrowing down what might be happening faster than a human clicking around dashboards alone and towards the end we talk about recovery practice known failures versus unknown failures why teams should test the failure modes they claim they can survive how smaller teams can learn from Meta-scale reliability patterns and why not every system needs six nines on day one so if you work around DevOps, SRE, platform engineering, infrastructure, engineering leadership, incident response, or you are just trying to figure out what reliability looks like when AI is increasing the volume of change, this one should be worth your time.

All right, let's jump in. Today, I'm joined by Francois Richard. He is an engineering director at Meta, and we're talking about reliability at scale, how AI and automation are changing production risk, what teams learn from incidents, and why recovery practice matters just as much as prevention. Francois, thank you for joining me. Thank you, thank you. Happy to be here.

Okay, so when you think about reliability at Meta scale, where does the work actually start? I think for me, reliability is actually two things. What people kind of like know usually it's the reactive side is how do we manage incidentss? How do we respond to problemss? And how do we handle things and recover and fall back when something goes bad?

But at the same time, it's also everything that I call like, you know, the proactive side of the house. This is everything that has to do with, hey, how are we going to prevent reliability problems from happening? What sort of guardrails do we put in place? What sort of framework? What sort of tooling do we allow platform or do we give to platform services and application developers to use?

And also, what is the real validation that we are doing? There's a lot of papers available in the public and so on around like, you know, there's something that we call like the storm program.

And it's basically our way to test like, you know, disaster recovery, where once in a while we take an entire region out, out of the like, you know, like if there was an earthquake or there was like a giant electrical grid failure. And we test what happens with the system. How do they recover? How do they handle the spike in traffic and so on?

So it's both like for me, reliability is both like, you know, the reactive side and also the proactive side. Is that kind of like chaos engineering, the concepts? Yes, yes, yes, exactly. And, you know, we go as far as, you know, disconnecting a complete region from the map. Interesting. Okay, so speaking about reliability, what makes an SLO useful instead of just another dashboard number?

Like, how do you think about that? Yes, an engineer, like a senior engineer that I work with always says that the SLO of something, of a system, is actually the promise that you're making to your customer. That, you know, XYZ should work 99.99% of the time and you should expect that amount of latency on average at, you know, P90 or something like this.

So we use this, like, you know, most of the platform we operate at Meta and also the product services and so on. They will all, the big ones, will all have some form of SLO for the top APIs or the top services that they are doing. We have some alerts that will trigger on SLO, but usually this is too late. Like, you know, we want to catch problemss.

The SLO allows us in the long run to actually figure out like, hey, are we investing enough in reliability? Are we keeping the bar high enough? Or do we have wiggle room to take some risk, introduce new features? Because you all know that when you introduce or you do a giant migration, there's a period of time where it takes time to stabilize things. So the SLOs are helping us make these decisions in the long run.

And you can clearly see when you've been tracking them for a while that some systems are trending up and some systems are trending down. And for the ones that are trending down, it allows you, it gives you the argument and the data to start investing more.

So this is kind of like, you know, our way about deciding if we have enough investment in an area or if, you know, we are okay and we can take more, you know, progressive risk. So you had, we talked a little bit about incidents before the show, and then you had just mentioned incidents. Across the incident lifecycle, Where do teams actually learn the most?

So in terms of learning during incidentss, I think it happens in two phases. First, it happens while handling the incident during what I call like the pressure cooker. When you actually need to handle the incident, you actually need to make decisions quickly, build consensus fast with a small group of people about what's the next action to take.

And then what are the bypass, the restart process, which system is calling what. This is actually a time where a lot of people, like junior engineers and senior, they learn a lot. They learn a lot about the system, but they also learn a lot about team dynamics and themselves during that period. Then the next phase happens when kind of like you build the...

Incident review report or we call it the SEV report, where you basically, you know, once the incident is handled, mitigated, you know, a few days after, you basically sit down and then we have like a tool to do this. And then people sit down and they write a report around like, you know, hey, what exactly happened? What was the root cause of this?

What was the exact timeline, which is kind of like forcing people to go back into logs and all of this? Could the alerts have fired earlier? Did we have the right instrumentation? Did we diagnostic, like diagnose this thing, like, you know, the proper way? And, you know, what are the follow -up tasks, like to make sure that this doesn't happen again?

Or that we have some level of automation to be able to remediate this type of problem automatically. So you build that report. But then from there, you go into a series of reviews. You review it with your team, with your organization. And if the incident was severe enough, we actually reviewed them at the company level. And during that time, it's a big opportunity to get feedback from other teams.

From other senior engineers that, yeah, we see this pattern. Here's, you know, how we handle this type of thing. And you actually learn a lot during that process. So this is usually like, you know, the learnings happen in kind of like two phases. Yeah. And so given that learning, what should an incident review actually produce? Like once the incident's over? The incident review, like we have a report type of thing.

It's a template. It has like, you know, walks you to, for you to get like two. The root cause of it. But I think the most important thing that it produces is also like, you know, what are the follow-up actions? The follow-up could be like, hey, we need to implement more redundancy. We need to implement better diagnostics. We need to implement better ways of handling these exceptions or problems.

We need a different deployment process. This is usually like, you know, the best outcome we could get because, you know, the more you mature your system, the more you'll be able to cover a lot of these, like, kind of like unknown slash unexpected situationss. So this is usually like the good outcome of these. And what do you find is the difference between finding the cause versus improving the system?

The difference between the cause and improving the system. Or is there a difference? There is a bit. Because for me, finding the cause overall is, do I have the right tools to pinpoint the problem very quickly. And then I'll be able to find the cause. And then the improvements are more are more about eliminating this exact problem or that class of problem.

And the improvement can be that like you know, like from a code structure that this will always happen, but you can work around with either deployment strategy, automation of recovery and things like this so that it's... It's not visible to the end users with strategies of retries and things like that. So there's a big difference between finding the cause.

Like if you work in mobile apps, you know that there's going to be a couple of cases where like the cause is going to be like, you know, the mobile networks just drop on you. And the app needs over time to come up with ways to mask it. You'll never eliminate the cause, but you'll have apps that are a lot better at masking this type of problem. So it's slightly different. Okay, so let's switch gears to AI agents.

Are you using AI in incident response at all? Yes. In triaging? We use it for what I would call like investigation. So, you know, there's usually like two classeses of production incidentss. You have one class when it happens. You kind of know what this is. Like, you know, it's a pattern that you already recognize. The alarms or alerts are very clear about what's happening.

So you kind of know and you can narrow down and then you can just go focus on, hey, you know, how do I remediate that? There are some of the cases like where you kind of see like, oh, I'm starting to see transient errors. I'm starting to see latency creeped up and where it's kind of like, I'm kind of not sure. And then usually like, you know, we launch what's called like investigations and things like that.

Really, the AI agents are helping us in investigation because they can analyze and gather large swath of data very, very quickly and then pinpoint relationships between datasets. Like, you know, it's probably the same for everybody, but we have multiple layers of software on top of each other. They call each other and they call back.

Sometimes finding complex situation requires us to analyze a lot of data at the same time. Even myself personally, like, you know, we have like centralized, like, you know, monitoring system.

And then if you aggregate a lot of data with very small granularity, like, you know, at the 10 second or like at the minute level, and you have a lot of time series, not the data point, it gets a pain to actually like get the right query and the right graph for the problem that you're investigating at a point in time like so the AI agent has kind of like shifted this thing where they help us find these things and even like you know in some cases like what i do is like i will dump all the metrics locally in the SQLite database and then like do all sorts of things because it's local and my SSD can do it a lot faster And then you use also the AI agents to help you craft the queries.

I don't remember on top of my head all the various flavors of joins and all of that. So it's helping a lot. So with investigation, it helps a lot. It's helping a lot. It's not perfect. You still need to guide it very well because the topology of the system, the request... The request flow between the system is still not something that I will call it like the various AI agents are actually mastering.

They master code very well. But these flows are a little bit more difficult and understanding how they map into the application or the product flows is even more complicated. But it does help. That's the investigation side of it. We're doing a lot also into what I call like having a standard dataset across the company that kind of like represents the state of reliability.

Like we drive a couple of initiatives globally, like we call it like change safety. Do you have SLOs for something? Do you have guardrails?

And with these datasets being kind of official, then it's easy for each service team or product team to build their own customized kind of dashboard like right now the cost of making dashboards is almost free and really tailoreded to their use cases or to their product using the standard dataset and that's another place where it's been like oh, this has been great.

And how are you, I'm assuming you're still validating that that root cause though right if it comes up with a you know it uses MCP servers it's reaching out to Argo Kubernetes whatever it's gathering all the telemetry from Grafana and then it's putting that together and it's saying, hey, this pod was crash loop back off. This caused this issue. Are you still validating that?

And what is that process for validating that? Like, is there a standard SOP that you're following? No, I don't think we have like a standard evaluation.

The evaluation, like most of the time, the tools that you have in the moment from an incident is either you move away from the problem or you roll back the problem so we will try like you know first you know move away let's call it like a problem is a backend problem it's isolated to a region we'll move away from that region to kind of like prove that theory and then we'll probably during that time roll back the system or the backend or whatever it was that introduced that problem and then you can imagine that we can then now that the hypothesis is live then we can shift a portion of traffic back to that problem and see like oh is it still happening or not this is all manual we have some of these process that are automated but they really boxed into very very well known like you know they had like very well established runbook that have been like you know in place for the longest time that we know that when this happened do this like it's almost like if then else But the most like the investigation result, the validation is more to roll out the fix, you know, driven by human with like, you know, slow roll type of techniques.

Do you think that AI is increasing the speed of change, the volume of change or the type of failure that teams need to expect? But it's clear that it's increasing the volume of change. We have data internally that, you know, the number of diffss is through the roof. The number of lines of code changed is, again, through the roof.

The type of failure is like one thing that, because there's more code and it's going faster, it's the type of failure becomes more into the, what I would call like pseudo-unexpected. When a product developer, application developer, when they... Roll out a new feature, they do understand the business logic.

They do understand how it should show to the user, what they expect the user to do, where's a corner where a user could get stuck. They understand that. That's not a problem. But if you have to build on modern apps on mobile phones or on backend, A lot of these things are built on top of frameworks. There's a lot of boilerplate stuff, especially to handle like, you know, async callbacks and things like this.

And since a lot of that code gets auto-generated, people are losing context around these things. And when something doesn't work, we realize that it takes us more time to understand why it doesn't work. Because there was not that additional context that...

The developer or that team developing that feature took a lot of time to craft it and a lot of like internal reviews and things like that so so it goes faster out but that context on how it's built is actually lost along the way and this is basically what we need to reconstruct live and again like i said earlier a lot of our tooling is like you know in this case we're just like we'll roll back and you figure it out like bring back the system to a stable state and then you can figure it out on your own time without being on the pressure cooker.

Okay, so speaking along the same lines, you had mentioned too that recovery comes down to practice. So what does good recovery practice actually look like? You know, there's a set of standard failuress you expect your app to have. And it starts at, you know, if you're running, if you have data centers or region in the United States or in Europe or something like that, you get...

Tons of things like fiber cut in hurricanes and, you know, power grid and things like that. You need to understand how your system will react.

Like, you know, a simple thing, like if I'm a startup and I run into a AWS region, but I actually never test the fact that one of them will go down, I can guarantee you, like, as soon as you get a little bit of complexity in your system, something will not work as expected in there.

For us is actually to do, to validate it, to not just test, like we run, I would call it like data simulation and analysis in advance to figure out like, okay, if we lose that data center, we'll be okay. But it is always interesting. And then after we've done the validation and vetted that it all worked. We actually do the test and we discover a suite of other problems that the analysis had never found.

So exercising the failure for real at the lower scale allows you to find a lot of these problems. And it's the same thing like, you know, if you have very sensitive hotspot in your application and your product, injecting failure for real at a very low percentage of user will...

Allow you okay do i have the right detection like did that trigger properly did it get to the right person did this team know how to handle it like without this it's it all becomes like improv like you improv all the time versus when you have a portion of your infrastructure that's always tested in such a way first you keep on hardening and it gets better and it gets better and the muscle of handling it gets better also so i guess that I was going to ask about like how, how would teams practice known failures versus unknown failures?

But it sounds like it comes down to just that practicing and pulling out the regions. Okay. And there's, there's a bunch of types of failure. Like, you know, I, I made an allusion about worst-case failures versus worst-case failure, which is, um, you know, you lose a complete region.

And with the weather patterns in the U.S., you know, we have hurricane season, we have like fire season, tornado, like the cuts happen everywhere. So you got to be ready. But there's also other things like, you know, for meta, we are often, I would call it like we got, we get these traffic spikes. It could be because there's something in the news related. It could be a big event like the Super Bowl, New Year's Eve.

The World Cup's coming. So we know that every time there's going to be a goal, it's going to spike. What we realize over time with practice is that some system will be overloaded. And in some cases, you'll have to restart them. And during overload, the damn thing cannot restart. You cannot kill it. Like it's all completely dead. Like it's completely blocked. So we practice a lot of these cases too.

And it's something specific. To us, we get these spikes that are kind of unexpected. Most systems have some form of overload protection up to a point, but it's something we really had to invest in, into like, in the worst load scenario, can I restart? Do I have, like, is my process smart enough to just accept requests later down the road?

Or do I have enough control in the traffic routing to, like, okay, choke the traffic, bring back up, warm up your memory, and then, like, gradually. Like, we had to practice that a lot. Yeah, so you're dealing with, like, thrashing and having, like, no... Yeah. Yes, yes. Resources being completely exhausted. Yeah, yeah. Completely gone. And is that typically at the control plane Completely gone.

And is that typically at the control plane level? Or... Some of our control plane is pretty good you know, there's some backend. Like you can imagine like, you know, an Instagram feedback an Instagram feed backend or Facebook feed backend same type of things. And we have a couple of academic paper. People can look at it. It's called like Taiji, I believe.

And then when we discuss these things on how we can reroute traffic and then control and then remove it from an area to allow the system to reload. Okay. So with that in mind. I would imagine most listeners are not operating at Meta scale, so they're not dealing with every time there's a goal at the World Cup, you know, their servers go down.

What ideas can actually transfer for most like SRE DevOps that are listening? I think the example I gave earlier, like you often see like no blame on Amazon, but if US East go down, like, you know, we see the world of the internet like go like berserk. So I'm like, guys, like, you know, you got to start testing these cases.

Like you've seen it happen, like, you know, at least like, you know, three or four times in the last two years. You got to start like, you know, having your dual regions and really validating it. And maybe it's a question about like, you know, every Tuesday, I do not run a single thing in US East, you know, whatever the name is these days to make sure that it's, you know, it's performing.

And then it's kind of like tackling the problems in a way like, you know, when you look at your incident inside a small, a smaller company, medium sized startup or so on, like I get a list of incidents.

There's a point where you start having enough data that you could say, okay, most of them are caused by, it's because we launched that feature or because we're doing configuration change or because we have a billing problem. It's starting to.

Trend your your SEV data and figure out hey what are the top two or three then we can start attacking and really focusing because like you can focus on everything but you'll get nowhere it's really start bucketizing like you know in having the discipline of writing it down like it's not that hard to write like a SEV report there's a lot of example in there and having the discipline of going back and Now with LLMs, do the analysis is kind of like trivial.

You need to, we used to need to allow a lot of people to do this and now it's a lot easier. So I think that's a big opportunity to actually really focus on where reliability matters. Yeah, that's fair. You had mentioned too that reliability expectations should match the system and product life cycle. Yes. Can you talk about that? Like, because 100 % uptime is not always like the right goal. Yes, yes, yes, yes.

There is.

There's like you know when i say about the expectation versus life cycle we should always expect like if something is is has some level of complexity and some level of feature at the beginning when you roll it out like you know getting two nines or even three nines of reliability it's pretty good like like like not a simple system that's that that that's usually like you can get it easy but like if it's early in the life cycle of that product or that backend at the beginning, it's going to be rocky and it should be expected.

Like I see a lot of people start with the assumption that, Hey, everything should be like six nines, six nines guys. Like this is like insane. Like, and you invest a lot and then you, you kind of like mix, uh, miss your product market fit while you're doing that. Like there are some like Facebook and Instagram, there's a gazillion experiments that runs at a given point in time.

Some of them are not fully reliable like and it's okay because we're trying to figure out if that feature will be something that users enjoy and use or not but they are other part of the app which like needs to be like rock solid and this is the place where we invest so depending on the life cycle if you are early or not because there's a cost at investing and then when especially like either your SRE or production engineering and you have to also convince your PM, your product managers that this is the case, having that conversation from that standpointpoint is a lot more easier than just like being the one that says, no, I need six nines of reliability for everything.

That's not happening. Yeah. Well, six nines too, that's like what, 31 seconds a year of downtime? I mean, the amount of infrastructure and cost complexity to just keep a system at scale. Depending on the system, I mean, I assume if it's like a very important financial system, maybe it matters. But for the majority of systems, like do the users really care about 31 seconds of outage per year?

I mean, are they going to? They do care. You know, we can see from our own data that, you know, if we have too much problems in a row, we can see that, you know, engagement eroding. So they do care. They do show. But it tends to stabilize when we stabilize things. So there's a correlation there. But sometimes the investment to reach that extra nine is just so high.

And while you're doing that extra nine, you're also sacrificing not just the speed and velocity, but also your mitigation time for future unknowns. Because when you have invested so much complexity and then you get into an unknown situation and then now you have to untangle all of this, your mitigation time will be higher. So it's kind of like it's a delicate trade-off. Like it's not a win-win all along.

Yeah, for sure. It's a reality there. A real conversation that you have to have and a balance that you have to have there. Okay, so wrapping up, this conversation also connects to At Scale systems and reliability. Why does that program feel relevant right now? Yeah. So we have this suite of conferences, like it's called At Scale. And we have like four conferences a year.

And the next one that's coming is basically systems and reliability together. And what we want to target for this specific conference is, hey, how are we injecting? What are the systems that are like, you know, building reliability for AI? And what are the systems that are under the hood for AI? Because people tend to talk about, hey, we talk about the models, okay?

But we never talk about like the underlying plumbing that is required to train and serve the model and the insane amount of data that we need to move back and forth. And then on the other angle, we also, we will discuss like... All the other areas where we actually use AI to enhance reliability. So it's both like, you know, both cases that we want to do. This conference is going to happen in person.

It's going to be in Bellevue. And you can find the detail. The website is at scale conference. And we could put that at the show notes. Yes. So if someone works in infra SRE platform or engineering leadership. Why should this be on their radar? And what are you watching specifically with the conference? I'm just curious. Personally, I'm a big fan of this conference. I've been part of it for a while.

And one thing that I tell the speakers that are coming from Meta, and we have speakers from NVIDIA, from Microsoft, from Google, the goal here, I want to have the real technical discussion. With Meta, I'm not in the business of selling cloud services. Like I'm not the business of selling API or things like this.

So what I want to talk is like, you know, Microsoft, you have a Kubernetes cluster with one million servers. How the hell did you do that? Like, this is like, you know, the goal is really like, I want to really understand the story behind the system. I want to have like the real technical conversation. And I want to avoid the sales pitch of like, oh. Use that service, use that thing.

So this is really the focus of the conference is to really have that technical discussion and also the story behind the system. Like, I'm always fascinated. I've always been fascinated by, like, okay, a team starts something. Like, I've been involved in ZooKeeper and all sorts of other things in my days at Yahoo back then. You start something, it was to solve a problem.

Then you open source and you're like, oh, that became this? Oh my God. So I'm really interested in this and then like the ups and downs of the team because you always have like, you know, the hype at the beginning and then, oh, the reality hits and you're like, oh my God, like this will not work as expected. And how do you overcome that?

Like that, for me, that's the most interesting part of all of these stories and all of these presentations. So, okay, wrapping up, what...

Kind of reliability conversations does the industry need more of i think right now the industry does understand the the use of AI for code generation like i think we get that i think we can get that we can go all out i think we understand that everybody can build a custom app like for themselves and they will only use it for for them it's gonna be perfect for them and then it's okay if it goes down but i think the rest of the industry has not kept up with that rate of change and there's not enough investment in kind of like defense like we're able to generate code are we able to debug it faster are we able to understand it faster are we able to troubleshoot it faster like like that has not kind of followed.

And then I feel that we are catching up now. And then the hype seems to be like mostly on, on the model. And then there's amazing infrastructure that had to be built underneathneath. And I think you know, everybody needs to understand it a little bit more. Yeah, for sure. Awesome. So I will put links for At Scale Systems and Reliability reliability in the show notes. I can put your LinkedIn there as well.

Is there any other links or comments that you'd like to give to the audience before we wrap up? No, I think that's it. Don't give up. Awesome. Thank you so much, Francois, for coming on. Really appreciate your time. Thank you so much. Thank you. Bye-bye. All right. That was my conversation with Francois Richard from Meta. My biggest takeaway from this one is that reliability is not just about preventing failure.

The better question is, what happens when prevention fails? Because sometimes the answer is a rollback. Sometimes it is moving traffic. Sometimes it is draining a region. Sometimes it is restarting a service. Sometimes it is realizing that the service cannot restart cleanly because it is already overloaded, which is the kind of fun little production detail that does not usually show up in architecture diagrams.

That is the part that I think is worth paying attention to. A lot of teams talk about reliability like it is mostly a tooling problem. Get the right dashboards. Get the right alerting. Define the SLOs. Add some runbooks. Maybe sprinkle in some AI and pretend the incident lifecycle is solved. But reliability is not just the tools. It is the practice around the tools.

It is whether the SLO actually represents a promise to users. It is whether the alert fires early enough to matter. It is whether the incident review produces real follow-up work instead of just a nicer explanation of what broke. It is whether the team has practiced the failure mode before production forces them to learn it live. And honestly, that is the part of the conversation that translates really well.

Even if you are nowhere near Meta scale. Most of us are not dealing with World Cup traffic spikes or massive global systems, but a lot of us are depending on a cloud region more than we want to admit. A lot of us say we are multi -region, but have not actually run without the primary region on a boring Tuesday. A lot of us have runbooks that look reasonable until someone has to follow them under pressure.

A lot of us have services that should recover automatically, but only if the failure happens in the exact way we imagined. That is where the work is. Practice the recovery. Test the boring assumptions. Look at your incident data. Bucket the causes. Figure out what keeps showing up. Then go after the top patterns instead of trying to boil the ocean.

I also liked Francois' point about AI changing the reliability equation. AI can absolutely help with investigation. It can look across a lot of data quickly. It can help build queries, connect patterns, and speed up the part where humans are trying to figure out what changed and what is related. But AI is also increasing the volume of change.

More diffs, more generated code, more boilerplate, more systems moving faster, and sometimes less human context behind the code that just went out. That is a weird trade-off. Because if code moves faster than understanding, Reliability teams are going to feel that gap during incidentsss.

The system breaks, and now someone has to reconstruct not just what changed, but why it changed, what the generated code is actually doing, what assumptions it made, and how to get back to a stable state. That does not mean AI is bad. It means the defensive side has to catch up. Debugging has to get better. Observability has to get better. Incident response has to get better. Recovery practice has to get better.

And humans still need to be in the loop for judgment, especially when the system is too important to let a guess turn into the next mitigation. I also think the lifecycle point matters. Not every system needs the same reliability target. A brand new experiment probably should not get the same investment as a core production path that millions or billions of people depend on.

Six nines sounds impressive until you realize what it costs, what complexity it adds, and how much slower it can make future changes. But the reverse is true too. If a system becomes important and the reliability investment never catches up, you are just borrowing risk until production collects. So maybe the healthier conversation is not how do we make everything maximally reliable.

It is more like what promise are we making? Who depends on this system? What happens when it fails? And have we practiced the recovery enough to believe our own answer? That is probably where a lot of reliability conversations are heading. Not AI will fix incidents. Not SLOs solve reliability. Not just make everything multi-region and call it done. More like, what failures should we expect?

What failures have we practiced? And what are we learning every time production teaches us something? I'll have links to Francois, Meta's At Scale systems and reliability event, and anything else we mentioned in the show notes. If you enjoyed this conversation, follow or subscribe to Ship It Weekly wherever you listen to podcasts.

It helps the show and it makes sure you get both these conversation episodes and the weekly DevOps, SRE, platform, cloud, and security news recaps. You can also find the show notes and links over at shipitweekly.fm. Thanks for listening, and I'll see you later this week.
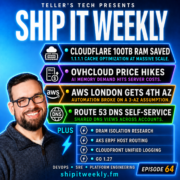
Scroll inside the box to read the full transcript.

An AWS data hall overheats. A single availability zone goes dark. And Coinbase spends hours recovering systems that were not as failure-independent as everyone hoped. Meta's AI support tooling becomes part of an Instagram account recovery path. And suddenly the chatbot is not just helping customers. It is touching identity. AWS has another agent tooling bug, this time in AgentCore CLI.

Where imported agent metadata could become generated Python code. And Google Cloud disclosed an Apigee cross-tenant issue, which is exactly the kind of phrase that makes cloud engineers sit up a little straighter. The theme this week is simple. The risky part of modern infrastructure is not always the big obvious production system. Sometimes it is the glue, the recovery path, the support workflow, the generated file.

The tenant boundary. The thing everybody depends on, but nobody quite treats like production until it breaks. I'm Brian Teller from Teller's Tech, and this is Ship It Weekly. Welcome back to Ship It Weekly, the show where we look at the DevOps, SRE, cloud, platform, and security stories that actually matter when you are the person who eventually has to keep the thing running.

This week, we're starting with Coinbase's May 7th outage postmortem. Then we'll talk about Meta's AI support incident, where attackers reportedly hijacked Instagram accounts through an AI-assisted recovery flow. After that, we'll get into AWS AgentCore CLI CVE-2026-11393, where collaborator metadata could break out into generated Python code.

Then we'll talk about Google Cloud Apigee and a cross -tenant vulnerability, because tenant isolation is one of those cloud promises you only think about when it fails. In the lightning round, we'll hit Cloudflare threat intelligence in WAF rules, AWS Lambda tenant isolation with event source mappings, the next generation of OpenSearch Serverless, and GitHub Enterprise Managed Users IP allow list coverage.

So let's get into it. First up, Coinbase published a postmortem for its May 7th outage. And this one is worth reading if you work anywhere near SRE, platform, cloud, infrastructure, Kafka, financial systems, or any system where people say we're multi-AZ and then everyone quietly hopes that means what they think it means.

Coinbase says that trading, deposits, withdrawals, and most customer -facing services were unavailable or degraded for roughly eight hours. Full recovery took even longer. The initiating event was physical. Multiple chiller units failed in a single AWS us-east-1 data hall, specifically availability zone use1-az4.

That cooling issue triggered a thermal safety shutdown of affected racks, taking EC2 instances and EBS volumes in that building offline. That is the part that looks like a classic cloud outage story. Something physical breaks inside a data center and cloud resources disappear. But the more useful lesson is what happened next. Because most of us already know that an availability zone can fail. At least in theory.

We have all seen the diagram. Three boxes, three AZs, nice clean arrows, everybody nods. Then a real failure happens, and the system has to prove whether those boxes were architecture or just decoration. For Coinbase, one major issue was that the matching engine was tied closely to the failed zone. And this is where the nuance matters. Low latency systems often make tradeoffs that normal apps do not.

If you need extremely tight latency, deterministic behavior, and careful state handling, you may choose a design that favors performance over easy failover. And that is not automatically irresponsible. But it does mean the recovery path has to be real, not theoretical. Not we documented it once. Real. Tested. Owned. Practiced. Known by more than one person. The other big lesson is state.

Coinbase called out delays around managed Kafka recovery. And that is extremely relatable. During an outage, stateless compute is usually the easy part. You restart it. You move it. You scale it. You reroute around it. Then you hit the system with state, ordering, offsets, replication, partitions, or money-adjacent semantics, and everything slows down. That is where incidents get complicated.

The app might be multi-AZ, but what about the broker? The database? The cache? The topic, the volume, the thing that keeps the system honest. That is the real test. The operator takeaway here is simple. Do not let multi-AZ become a comfort phrase.

Find the parts of your system that are still effectively tied to one zone, one stateful dependency, or one recovery path, especially the low-latency pieces, the Kafka pieces, the databases, the matching engines, the services with ordering, offsets, or money adjacent semantics. Then ask the annoying question, what happens if that AZ disappears? What depends on recovering in place? What can actually fail over?

How long does it take? And when was the last time we proved it? Because resilience is not where the diagram says the boxes are. It is where the system can actually recover when one of those boxes disappears. Second story, Meta confirmed an incident involving its AI-assisted Instagram support flow. Where more than 20 ,000 accounts were likely impacted.

The reported issue was that attackers could use Meta's AI support tooling to trigger password reset links to an email address that was not actually associated with the victim's account. Meta described it as a bug where the system did not properly verify that the provided email matched the email on the Instagram account. So attackers could receive reset links for accounts they did not own.

Now, I know what you might be thinking. Instagram accounts do not sound like a normal DevOps or SRE story. But the real story is not social media accounts got hacked. The real story is this. AI support automation became part of an identity recovery control plane. And that is absolutely our lane. Account recovery is privileged infrastructure.

It is the break-glass path for identity it can reset passwords it can change emails it can bypass parts of the normal login path when the user needs help that means it has power and if ai can influence that workflow then the ai is not just answering support questions anymore it is participating in an identity decision that changes everything a chatbot that answers how do i update my profile photo is one thing A chatbot that helps move an account recovery flow forward is very different.

That system needs real authorization logic, real verification, rate limits, abuse detection, audit logs, escalation paths, blast radius controls, and a very clear line between what AI can suggest and what the system is allowed to do. Because attackers do not care whether your org chart says this belongs to support. Identity, security, product, or infrastructure. They care that the workflow can reset accounts.

So they attack the workflow. This is also a reminder that AI risk is not always a coding agent running shell commands. Sometimes it is much more boring. A support flow trusts the wrong field. A reset link goes to the wrong place. And suddenly, the AI part gets the headline. But the real failure? Is the control boundary around the action. The takeaway here is not AI support is bad.

The takeaway is that support workflows can be privileged infrastructure. Password resets, MFA resets, email changes, account recovery, support impersonation, admin ownership changes. Those are not just customer service features. Those are identity control paths. So when AI gets added to that flow, The question is not just, is the answer helpful? The question is, what can this workflow actually do? Can it suggest?

Can it route? Can it trigger actions? Can it change trust? And if it can touch identity, it needs the same seriousness as any other production control plane. Because the scariest AI system in production might not be your coding agent. It might be the support flow that can reset passwords. Third story. AWS published a security bulletin for CVE-2026-11393 in AgentCore CLI.

And if last week's Kiro bug was stdin answered the approval prompt, this one is more like agent metadata became Python code, which is not the kind of sentence you want in a security bulletin. The issue involves AgentCore CLI when importing a Bedrock supervisor agent with multi-agent collaboration enabled.

The advisory says the CLI fetched collaborator metadata from the Bedrock API and inserted the collaborationInstruction field into a triple quoted Python string in the generated main.py file. The problem was improper escaping of triple quotes. So a crafted instruction could break out of that intended string and inject Python code into the generated file.

Then, if the file was run locally or deployed into AgentCore Runtime, the injected code could execute with the credentials available to that environment.

AWS recommends upgrading the CLI, removing affected imported agents rerunning the import with the patched cli and redeploying if you cannot upgrade right away they recommend manually inspecting generated main.py files for suspicious triple quote sequences in collaborator instructions now this is preview tooling and the attack path is specific but the pattern matters generated code is code that sounds obvious but teams do not always treat generated code with the same suspicion as handwritten code.

Generated files feel like outputs, artifacts, something the tool made, something official, something you probably do not need to read too closely. But if untrusted or semi-trusted metadata gets inserted into source code, your generator becomes a compiler for attacker-controlled input. And we have seen this movie before. SQL injection. Template injection. Shell injection. CI config injection.

YAML templating weirdness. Now it is agent metadata turning into Python. Different costume, same villain. The AI angle makes it feel new, but the secure engineering lesson is old. Do not turn text into executable content without a hard boundary. Do not assume metadata. Is safe because it came from an API. Do not assume generated code is safe because it came from an official tool.

And definitely do not assume instructions are harmless. In agent systems, instructions are operational inputs. They can shape behavior. They can get passed between systems. They can become config. They can become prompts. And sometimes they can become code. The takeaway here is short. Generated code is still code.

If a tool turns metadata, instructions, templates, or agent definitions into executable files, that path needs review. Keep the CLI updated. Inspect generated files before running them in trusted environments. Run agent tooling with limited permissions. And pay attention to what credentials are available if something goes wrong. Because the blast radius is not just the bug.

The blast radius is what the generated code can access when it runs. Fourth story. Google Cloud disclosed a vulnerability in Apigee, CVE-2025-13292. Google's release notes say the issue could have allowed a malicious actor with administrative or developer -level permissions in their own Apigee environment to elevate privileges and access cross-tenant data.

NVD describes it as unauthorized read and write access to Apigee analytics data and access logs belonging to other customer organizations. Google says the issue was patched and no user action is required. That is good. But the phrase that matters is cross-tenant. Tenant isolation is one of the deepest assumptions in cloud computing. You have your environment. Other customers have their environments.

The provider keeps those boundaries in place. That is the model. Most of the time, you do not have to think about it. And you cannot think about it all day. If cloud customers had to constantly wonder whether another tenant could see their logs, analytics, objects, volumes, or traffic, nobody would get anything done. So when a managed service has a cross-tenant issue, even a patched one, it is worth paying attention.

And Apigee is not some random side tool. API management sits in a sensitive part of the stack. It can see traffic patterns, access logs, analytics, client behavior. API paths, timing, errors, and sometimes more than people realize. Access logs are not always harmless. They can reveal service names, query parameters, client identifiers, internal routing, usage patterns.

And because logging systems are logging systems, sometimes they capture fields everyone later wishes had been redacted. So cross-tenant access to analytics and logs is not just a privacy issue. It can be a reconnaissance issue, a compliance issue, a customer trust issue. The takeaway is not never use managed services. That would be ridiculous.

The takeaway here is that tenant isolation is not just a cloud provider promise. It is a design requirement. For every platform team building multi-tenant systems, logs, analytics, dashboards, exports, admin tools, support consoles, background jobs, search indexes, all of those can become tenant boundary problems. So do not only test the obvious request path, test the internal paths too.

Can tenant A see tenant B's logs? Can a support view cross the wrong boundary? Can an analytics query forget tenant context? Can an async job mix records that should never touch? Cross tenant bugs usually do not start in the happy path. They start in the seams. Now let's do a quick lightning round. First, Cloudflare is turning threat indicators into real-time WAF rules.

Cloudflare says Cloudforce One threat intelligence can now be used directly inside the WAF engine. That means teams can write rules based on things like known attacker names, targeted industries, source countries, target countries, and attack context. I like the direction. It moves security from, we know this traffic is bad, towards we can actually enforce on that knowledge. But the operator warning is obvious.

Threat intel in the blocking path is still production change management. Start in visibility mode. Watch false positives. Stage the rollout. Make sure that the logs explain why something was blocked. Automation is great until it blocks your biggest customer because a field matched a little too creatively. Second, AWS published guidance. For Lambda tenant isolation mode with event source mappings.

The interesting part is that async systems do not naturally carry tenant context the same way synchronous API requests do. With an API request, you may have headers, claims, and request context. With SQS, EventBridge, or other event sources, tenant identity may be inside the payload or may need to be extracted and passed along carefully. That matters because multi-tenant bugs love async systems.

A message loses context. A worker assumes the default tenant. A retry uses the wrong metadata. A batch mixes records that should never be mixed. Tenant isolation is not just about the runtime. It is about context propagation. Especially when queues and events are involved. Third, the next generation of Amazon OpenSearch Serverless is generally available.

AWS says it provisions faster, scales faster, supports scale to zero, and can reduce costs compared to provisioning for peak load. That is a FinOps story, but it is also an operations story. If teams start treating search and vector infrastructure as more elastic and disposable, they still need to understand cold starts, latency, indexing behavior, cost patterns, and traffic spikes.

Serverless does not mean operationally invisible. It means the operational questions moved. Fourth, GitHub Enterprise Managed Users IP Allow List coverage is generally available. Enterprises using EMUs can now enforce GitHub's native IP Allow List configuration across user namespaces. That matters. Because source control is production infrastructure. Repo access is part of your security boundary.

And more of that boundary is moving into identity, network policy, device posture, and enterprise governance. IP allow lists do not solve everything. But repo access is still one of the fastest ways to turn a credential problem into a production problem. The human closer this week is about the glue. Coinbase was not just an AZ failure. It was state, latency, Kafka, and recovery paths.

Meta was not just an AI support bug. It was account recovery becoming identity infrastructure. AgentCore was not just a Python escaping issue. It was metadata turning into executable code. Apigee was not just a patched cloud vulnerability. It was tenant isolation showing up in logs and analytics, not just the main product path. Different stories, same pattern.

Modern reliability and security problems keep showing up in the seams. The support flow. The generated file. The recovery path. The admin console. The queue. The logs. The things between two systems that quietly decides what is allowed to happen next. That is where a lot of real platform work lives now. Not just making the app scale. Not just adding another region. Not just buying a managed service.

But asking where the authority actually sits. Who can recover an account? Who can generate code? Who can access another tenant's data? Who owns the failover path? Who tested the recovery plan? And who gets paged when the glue fails? So the takeaway this week is simple. Do not just review the big production systems. Review the seams. That is usually where the incident is waiting.

That's it for this week of Ship It Weekly. We covered Coinbase's May 7th outage postmortem, Meta's AI support and Instagram account recovery issue, AWS AgentCore CLI CVE-2026-11393, Google Cloud Apigee's cross-tenant vulnerability, and a lightning round on Cloudflare WAF threat intel, AWS Lambda tenant isolation, OpenSearch Serverless, and GitHub Enterprise Managed Users IP allow lists.

If this episode was useful, follow or subscribe wherever you are watching or listening. If you are on YouTube, hit subscribe. If you are in a podcast app, follow the show there. And if you know someone dealing with cloud resilience, AI support workflows, agent tooling, tenant isolation, or repo governance, send this one to them.

It helps the show grow, and it helps me keep making this kind of content for people who actually live with these systems. You can find the weekly brief at OnCallBrief.com and more episodes and this week's show notes at ShipItWeekly.fm. I'm Brian Teller from Teller's Tech. Thanks for listening. And remember, the system that breaks production is not always the big obvious service.

Sometimes it is the glue everybody forgot was holding the whole thing together.

Scroll inside the box to read the full transcript.

Your AI coding tool asks for permission. Then stdin answers for you. That is not a sentence I expected to say this week, but here we are. This week, we've got Kiro CLI with an approval bypass through piped input. Amazon Braket with a very normal Python pickle problem inside a very expensive-sounding quantum SDK. AWS Organizations finally logging account membership changes to CloudTrail.

And KEDA releases that remind us autoscaling upgrades are not just version bumps. Then in the lightning round, we'll hit Kubernetes dashboard being archived, Google Cloud's managed MCP server for AlloyDB, Kafka 4.3 .0, and Atlassian's AI productivity claims around more pull requests and saved developer time. The theme this week is pretty simple.

Automation keeps getting more authority, but the boring boundaries still decide what happens. I'm Brian Teller from Teller's Tech, and this is Ship It Weekly. Welcome back to Ship It Weekly. The show where we look at the DevOps, SRE, cloud, platform, and security stories that actually matter when you are the person who eventually has to keep the thing running.

This week is a nice mix of AI tooling risk, cloud governance, Kubernetes operations, and the ongoing question of what happens when automation gets more power than people realize. We're starting with Kiro CLI and a bug where crafted piped input could be treated like user approval. Then we'll talk about Amazon Braket SDK and an insecure deserialization issue in quantum job results.

After that, we'll get into AWS Organizations finally emitting CloudTrail events when accounts join or leave an organization. Then we'll talk KEDA 2.20 and 2.19. Because autoscaling upgrades can move assumptions around events, permissions, scalers, and monitoring.

In the lightning round, we'll hit Kubernetes Dashboard being archived with Headlamp as the path forward, Google Cloud Remote MCP Server for AlloyDB, Apache Kafka 4 4.3.0, and Atlassian's AI-native SDLC productivity claims. And the human closer this week is about hidden boundaries, because the scary part of automation is not always what it can do. Sometimes it's what we forgot it was allowed to do.

So let's get into it. First up, Kiro CLI had a pretty interesting security issue. AWS published a bulletin for CVE-2026-9255 affecting Kiro CLI versions before 1.28.0. The short version is that crafted content piped into Kiro CLI through stdin could be consumed as confirmation input, and that could allow tools, including shell commands to execute without the user actually approving them.

So yes, the AI tool asked for permission. And stdin answered for you, which is funny in the way that makes you stop smiling after about half a second. Because this is not just a random command-line parsing bug. This is an approval boundary bug. A lot of AI coding tools are built around the idea that the agent can suggest actions, but the user approves the risky parts.

That approval step is the thing that makes people feel safer. The tool says, hey. I want to run this command. The human looks at it and says yes or no. That is the mental model. But if crafted input can accidentally or intentionally flow into the confirmation path, now that boundary is not really where people thought it was. And that matters because these tools are not just answering trivia questions.

They can read files. They can inspect repos. They can call tools. They can run commands. They can modify code. They can sometimes interact with cloud CLIs, Kubernetes configs, package managers, and all the usual developer machine chaos. So when approval gets weird, the blast radius gets weird too. The practical lesson here is bigger than Kiro.

If you are building or adopting AI tools, Approval needs to be treated like security controls, not UX prompts. Security controls. That means you should think about where approval input can come from. Can it come from standard in? Can it come from a file? Can it come from pasted content? Can it come from generated content? Can it come from previous agent output?

Can it come from something the model read and then accidentally turned into an action? Because when an AI tool has access to execution, The approval path is part of your trust boundary. And trust boundaries are where boring bugs become very interesting. For operators and platform teams, I would treat this as another reminder to be careful with agent tooling in high trust environments. Keep tools updated.

Avoid running agentic CLIs with broad permissions unless you really need to. Be careful piping untrusted content into tools that can execute actions. And do not assume that a confirm before running prompt automatically means the human is the only thing that can confirm. The button is not the boundary. The input path is. Second story. Amazon Braket SDK had an insecure deserialization issue.

And I have to admit, there is something funny about quantum computing getting a very normal Python pickle bug. Like, yes. We are doing quantum workloads and advanced simulation and cloud-managed quantum jobs. But also, somewhere in the middle of that, Python Pickle is still standing there with a folding chair. AWS published a bulletin for CVE-2026-9291 affecting Amazon Braket SDK versions before 1.117.0.

The issue involved job results. The SDK trusted a data format field in job result JSON. And under the wrong conditions, it could call pickle.loads() on attacker-controlled data. That could lead to remote code execution for a remote authenticated user with S3 write access to the job output bucket. This is a very specific vulnerability, but the pattern is extremely familiar. You have an SDK. You have job output.

You have S3. You have metadata that says what format the data is in. And somewhere in that chain, the client trusts the metadata too much. Then the parser becomes an execution path. That is the lesson. Deserialization bugs are not old news just because the service sounds modern. Pickle is dangerous when used on untrusted input. That sentence has been true for a very long time.

And apparently, it is still true even if the words around it include quantum computing. For DevOps and platform teams, I think the takeaway is about the trust boundaries around job output and storage buckets. A lot of systems treat output buckets as boring storage. The job writes results. The client reads results. Everybody goes home.

But if the client treats those results as trusted instructions for how to deserialize data, then whoever can write to that bucket may be influencing code execution on the client side. That changes the security posture. So yes, patch the SDK. But also, think about the surrounding pattern. Who can write to job output buckets? Are those buckets shared? Are they cross-account?

Can temporary jobs write results that other systems later consume? Are clients running in developer environments, CI, notebooks, or production workflows? And are any of those clients deserializing data in a way that assumes storage means trusted? Because storage is not trust. Storage is just where the problem waits politely until something reads it.

Before we get to the next story, a quick word from this week's sponsor, @Scale: Systems & Reliability. @Scale: Systems & Reliability is happening June 25th at the Meydenbauer Center in Bellevue, Washington. The event is focused on the infrastructure behind AI-scale systems, reliability, high-performance compute, storage, networking, and the operational side of AI-driven systems.

So if you are thinking about how reliability changes when AI workloads, agents, and automation enter the picture, this is worth a look. Register today at atscaleconference.com/events/systems-reliability-2026 or use the link in the show notes. All right, back to the show. Third story, AWS organizations now emit CloudTrail events when accounts join or leave an organization.

And this is one of those updates that sounds small until you remember what AWS Organizations actually represents. An AWS Organization is not just a billing container. It is a security boundary. It is where SCPs apply. It is where centralized logging expectations live. It is where guardrails live. It is where account ownership and governance gets enforced.

So when an account joins or leaves an organization, that is not just an administrative event. That is a security and governance event. AWS says organizations now emit account joined organization and account departed organization events to the management account. Those events include things. Like the join or departure method and timestamp.

You can feed them into CloudWatch alarms, EventBridge roles, or whatever your alerting and governance process looks like. And honestly, this feels like one of those things that should have already existed, which is not a compliment exactly, more like a very cloud engineering version of relief. Because account movement is the kind of thing you want to know about immediately.

If an account leaves your organization, what happened to the SCPs? What happened to centralized CloudTrail? What happened to Config rules? What happened to Security Hub aggregation? What happened to access policies that assume the account is still under org control? And if an account joins your organization, is that expected? Is it coming from an acquisition? A sandbox? A delegated admin flow?

A weird test account someone created with a personal email in 2021 and is now trying to bring home like a stray cat. The practical takeaway is pretty simple. Do something with these events. Do not just mentally file this under nice AWS improvements. Create EventBridge rules. Alert on account join and departures. Send them somewhere your cloud platform or security team actually watches. Attach context if you can.

Was this account expected? Who owns it? Which OU did it join? What guardrails apply? Was the departure planned? Do we need to investigate? Because the worst time to discover an account left your organization is later, when you are trying to explain why the normal guardrails did not apply. Account membership is not just billing metadata. It is control plane state. And control plane state deserves alerts. Fourth story.

KEDA has had a couple of releases. Worth operators actually reading. And I know, a KEDA release note is not exactly the kind of thing that makes people cancel dinner plans. But autoscaling changes are production changes. KEDA sits in a very sensitive part of the system. It watches external signals. It decides when workloads should scale.

It interacts with Kubernetes events, RBAC, metrics, scalers, and workload behavior. So when KEDA changes event recording, scalers, permissions, or assumptions, that is not just a version bump. That is part of how your workload responds to pressure.

The on-call brief this week flags KEDA version 2.20 and version 2.19 changes, including event recording moving to the events.k8s.io API group, plus scaler changes and additions around things like OpenSearch, Elastic Forecast, and Kubernetes resources. The event recording change is the one I would pay attention to because events sound like observability garnish until something breaks.

Then suddenly, everybody wants to know what scaled, when it scaled, why it scaled, what failed, and which controller said what. If events move API groups, that may affect RBAC. It may affect tools that scrape or watch events. It may affect alerting. It may affect the way your team reconstructs scaling behavior during an incident. And that is the hidden risk with autoscaling systems.

When they work, nobody thinks about them. When they fail, everybody discovers they are part of the incident timeline. The practical takeaway is not avoid KEDA upgrades. KEDA is useful. The takeaway is to treat autoscaler upgrades like production behavior changes. Read the release notes. Check RBAC. Check event collection. Check dashboards. Check scaler-specific changes for the triggers you actually use.

Test the upgrade in a non-prod cluster with real-looking metrics if you can. And make sure your team still knows how to answer the basic questions. Why did this workload scale? Why did it not scale? What signal was it watching? What did KEDA think was happening? And where would we see that during an incident? Autoscaling is one of those areas where it just works is great right up until it very much does not.

Now let's do a quick lightning round. First, Kubernetes Dashboard has been archived and Headlamp is the path forward. We have mentioned Headlamp before, so I'll keep this short. The new angle is that dashboard being archived means platform teams should decide what the supported cluster UI actually is.

If developers, support engineers, or internal teams rely on a UI to inspect workloads, logs, events, or namespaces, that UI is part of your platform surface. So do not let the migration happen by accident. Decide what you support. Decide who gets access. Decide how auth works. Decide what actions are allowed. And please, do not replace one risky dashboard with another risky dashboard and call it modernization.

Second. Google Cloud Remote MCP Server for AlloyDB is generally available. I know we have covered MCP a lot, so I'm not going to make this the whole show. But the trend matters. MCP is moving from local developer demos into managed cloud data access. That means the questions get more serious. Who can connect? What data can the agent reach? What identity is used? What audit trail exists? And can the agent only read?

Or can it take action? Managed MCP is not just convenience. It is another control plane for agent access. Third, Apache Kafka 4.3 .0 is out. For most people, a Kafka release is not something you rush into production during lunch. At least I hope not. But it is worth tracking because Kafka sits under a lot of real-time systems, event-driven platforms, data pipelines, and very nervous on-call rotations.

The high-level takeaway is simple. Read the release notes. Watch client compatibility. Check broker upgrade paths. Check the features that affect your actual deployment model. And remember that Kafka upgrade is rarely just a Kafka upgrade. It usually involves consumers, producers, schemas, connectors, monitoring, retention, partition behavior, and some service nobody remembered still uses the old client.

Fourth, Atlassian published AI-native SDLC productivity claims around more pull requests and saved developer time. The numbers sound good. More PRs. More time saved. More development throughput. And I am not against that. But more PRs is not automatically more throughput. If planning, review, testing, security, release, and operations cannot absorb the extra output, then you may not have improved flow.

You may have just moved the bottleneck. AI can absolutely help teams produce more work. The leadership question is whether the system can safely absorb it. Because more code is not the same as more value. And it is definitely not the same as more reliable production. The human closer this week is about hidden boundaries. That is the thread running through all of this. Kiro CLI had an approval boundary.

Amazon Braket had a deserialization boundary. AWS Organizations has an account membership boundary. KEDA had an autoscaling and event visibility boundary. Kubernetes Dashboard and Headlamp sit on the platform access boundary. MCP sits on the agent data access boundary. Kafka sits on the event pipeline boundary. And AI productivity claims run straight into the boundary between output and actual throughput.

The scary part of automation is not always what it can do. Sometimes it is what we forgot it was allowed to do. That is the part teams need to keep looking at. What counts as approval? What counts as trusted data? What counts as an account boundary? What counts as a safe scaling signal? What counts as supported platform access? What counts as developer productivity? Those are not abstract questions.

Those are production questions. Because automation does not remove boundaries. It moves them. And if you do not know where the boundary moved, you may not know what you are trusting anymore. And that is where staff and principal engineering work often lives. Not just picking the tool. Not just approving the upgrade. Not just reading the headline. But asking where the authority actually sits now. Who can approve?

Who can write? Who can scale? Who can access? Who can deserialize? Who can query? Who can ship? That sounds boring. But boring is usually where the real risk is hiding. So the takeaway this week is simple. When automation gets more powerful, look for the boundary. Then make it visible. That's it for this week of Ship It Weekly.

We covered the Kiro CLI approval bypass, Amazon Braket SDK insecure deserialization, AWS Organizations CloudTrail account membership events, KEDA autoscaling changes, and a lightning round on Kubernetes Dashboard and Headlamp, Google Cloud Remote MCP Server for AlloyDB, Kafka 4 4.3.0, and Atlassian's AI-native SDLC claims. If this episode was useful, follow or subscribe wherever you are watching or listening.

If you're on YouTube, hit subscribe. If you are in a podcast app, follow the show there. And if you know someone on a DevOps, SRE, platform, security or engineering leadership team who is dealing with AI tools, AWS governance, Kubernetes autoscaling, or platform access, send this one to them. It helps the show grow and it helps me keep making this kind of content for people who actually live with these systems.

You can find the weekly brief at OnCallBrief.com and more episodes and this week's show notes at shipitweekly.fm. I'm Brian Teller from Teller's Tech. Thanks for listening. And remember, If your AI tool asks for permission, your SDK trusts a pickle, your account leaves the org, or your autoscaler changes behavior, the question is not just what happened. The question is where the boundary was supposed to be.

Scroll inside the box to read the full transcript.

Trusted tools are having a rough week. A popular VS Code extension reportedly helped expose thousands of GitHub internal repositories. Megalodon hit thousands of public repos with poisoned commits and GitHub Actions workflow abuse. Railway had a platform-wide outage after Google Cloud incorrectly suspended its production account. Discord dropped 17% of active sessions during a Kubernetes migration.

And AWS is changing SDK retry behavior, which sounds boring until you remember retries are how your app behaves when the world is already on fire. The theme this week is simple. The tools that we trust most are becoming some of our riskiest production dependencies. I'm Brian Teller from Teller's Tech, and this is Ship It Weekly.

Welcome back to Ship It Weekly, the show where we look at DevOps, SRE, cloud, platform, and security stories that matter when you are the person who eventually has to keep the thing running.

This week, we're starting with GitHub supply chain risk from two directions: a compromised VS Code extension tied to a GitHub internal repo breach and the Megalodon campaign abusing public repos and CI/CD workflows then we'll talk about railway's gcp account suspension outage discord's voice outage postmortem AWS changing SDK retry defaults, and a RabbitMQ AWS plugin issue that accidentally shipped debug code into production builds.

In the lightning round, we'll hit OpenTelemetry Graduation, Claude Code RCE, GitLab Secrets Manager, Google Cloud AI Spend Caps, and a Redshift Python driver RCE. And the human closer is about trusted tools because the systems we trust most are often the ones we forget to threat model. So let's get into it. First up, GitHub had a rough supply chain week. The developer toolchain got hit from multiple directions.

The first story is the Nx Console VS Code extension compromise. Reporting says a malicious version of the Nx Console extension was published and that the extension was later tied to a breach involving thousands of GitHub internal repositories. StepSecurity says the compromised version was Nx Console 18.95.0 and that the root cause involved a contributor's GitHub token being scraped in a prior supply chain attack.

The Hacker News reported that roughly 3,800 GitHub internal repositories were exposed after a GitHub employee device was compromised through the malicious extension.

Now, I'm not saying every VS Code extension is evil, but every VS Code extension is still code running next to the repos you clone, the terminal you use, and sometimes the tokens you forgot were still hanging around, which is not exactly a low-trust environment. A lot of developers install extensions like browser tabs. That looks useful. That has a nice icon. That has a lot of installs. Sure, why not?

And normally that feels fine until an extension update becomes an initial access path. That is the real lesson. The developer workstation is part of the production attack surface now, not because it serves customer traffic, because it touches the things that eventually do. Repos, secrets, CI/CD, cloud credentials, deployment tooling, package publishing, SSH keys.

Kubeconfigs all the fun little artifacts we pretend are carefully managed until somebody runs `ls ~/.aws` and the room gets quiet. Then there's Megalodon. Security researchers reported a campaign hitting more than 5,500 public repositories with malware -laden commits, stealing CI/CD secrets like AWS and Google Cloud keys. SSH private keys, and Kubernetes configs. That makes this more than a GitHub story.

It's a reminder that CI/CD is not just where code gets tested. It is where trust gets converted into artifacts. If a workflow has cloud credentials, package publishing tokens, signing keys, or deployment authority, then a compromised workflow is not just a dev problem. It is a release system compromise. The takeaway is not ban all extensions or never use GitHub Actions. That's not serious.

The takeaway is to treat developer tooling as production-adjacent infrastructure. Review extensions with broad file, terminal, or workspace access. Use short -lived credentials where you can. Keep cloud keys out of CI when OIDC works. Lock down GitHub Actions permissions. Require review on workflow changes. And please.

Do not let every workflow run with full write access because that was easier during the first setup. A trusted extension, a trusted repo, and a trusted workflow can all become part of the same attack path. That's the part that matters. Next up, Railway published an incident report about a platform-wide outage caused by Google Cloud. Incorrectly suspending Railway's production account.

That sentence alone is enough to make most cloud engineers sit up a little straighter. Railway says the outage started on May 19th when Google Cloud incorrectly placed their production account into a suspended status. That took Railway's API, dashboard, control plane, databases, and GCP-hosted compute infrastructure offline. And then it got more interesting.

Railway also runs workloads on Railway Metal and AWS burst-cloud environments. And those workloads initially stayed up. But Railway's edge proxies relied on a GCP-hosted control plane API to populate routing tables. So when route caches expired, the outage cascaded beyond GCP.

Workloads that were still technically running became unreachable because the network control plane could no longer resolve routes to active instances. At peak impact, Railway says all workloads across all regions were unreachable. And that is the story. Not just Google Cloud suspended an account. The real story is that multi-cloud did not save the system because the control plane dependency was still in the hot path.

That is where architecture diagrams get too optimistic. You can draw AWS over here and GCP over there. Metal in another box. Some arrows, maybe a nice little mesh diagram. And suddenly, everybody feels resilient. But resilience is not about how many providers appear on the diagram. It is about what has to work during a failure.

If your data plane in AWS still needs a control plane API in GCP to route traffic, then GCP is still in the hot path. If your failover region needs the primary region's identity system to approve failover, then the primary region is still in the hot path. If your emergency deploy process depends on the same CI/CD platform that is currently broken, then congratulations.

You have invented a circular dependency with branding. The strongest thing in Railway's writeup is that they owned it. They said that they take responsibility. For the architectural decisions that allowed one upstream provider action to cascade into a platform-wide outage. That's the right posture.

Customers do not care whether the thing that broke was technically Google, Railway, GitHub, Stripe, AWS, or a squirrel with a networking certification. They see your product. So when you say multi-cloud, ask what dependency is still centralized? What service discovers routes? What service holds identity? What API does the edge need? What happens when cached state expires?

And what dependency do you only discover when the provider account disappears and everyone suddenly becomes very interested in architecture diagrams? Multicloud is not magic. Sometimes it is just single cloud with extra invoices. Third story. Discord published a really good postmortem. On its March 25th voice outage. The title is perfect. You've got too much mail.

Because this outage wasn't just Kubernetes killed some pods. It was a chain reaction where a routine infrastructure change hit a stateful system, dropped a large number of sessions, and downstream systems got overwhelmed by the recovery behavior. Discord says voice and video suffered major degradation. For a little over three hours. Users were mostly unable to start or join calls and saw an awaiting endpoint message.

The trigger came during a Kubernetes migration for Discord's Elixir services. They were tuning session management service resources and pod counts. As Kubernetes applied the change, it terminated 50 % of the pods in one zone. Since sessions were balanced across three zones, about 17% of active sessions were ungracefully stopped. That alone is not great. But the cascading part is the real lesson.

Discord’s systems use Elixir GenServer processes, and those processes have mailboxes. When all those sessions vanished, other processes received a flood of messages saying sessions were down. That caused reconnect behavior, rate limit pressure, memory spikes. Gateway problems, and eventually voice and video routing issues.

This is the kind of postmortem that I love because it shows how real outages are usually not one failure. They are interaction failures. Kubernetes did what it was told. The session service had handoff logic. The rate limit existed. The downstream services were designed for normal load, but the shape of the change produced a workload the system was not tuned for.

That is the part people miss when they say, why didn't they just autoscale? Because auto scaling is not a magic undo button for we just invalidated 17% of active sessions and created a reconnect storm. Sometimes the bottleneck is not CPU. Sometimes it's mailbox length, back pressure, downstream fanout. Or one angry queue quietly becoming the main character. The practical takeaway is migration safety.

When you move stateful systems into Kubernetes, think beyond pod termination. What does the rest of the system do when this pod terminates? Who gets notified? Who retries? Who reconnects? Who queues messages? Who gets overloaded trying to help? Graceful shutdown is not just a pod lifecycle feature. It is a system behavior. If you are doing Kubernetes migrations for stateful services, test the ugly cases.

Kill more than one pod. Drain a zone. Watch downstream queues. Look at reconnect behavior. Because production does not ask if the change was routine. It asks if the system was ready. Fourth story, AWS is changing retry behavior across AWS SDKs and tools. And I know that that sounds like the kind of story that you would normally skip because it has the emotional energy of a configuration footnote.

But retry defaults are invisible infrastructure. They affect latency, error rates, load during outages, and how your app behaves. When AWS services are already struggling. AWS says the updated retry behavior is available now behind opt-in and will become the default in November, 2026. The updated behavior changes how standard and adaptive retry modes handle failures.

AWS is making standard mode the default for SDKs that previously defaulted to legacy mode, adding retry quotas where they didn't exist. Changing backoff timing and treating transient errors differently from throttling errors. One big change is that transient error retries cost more retry quota than before.

The idea is that during sustained outages, the SDK fails faster instead of endlessly retrying and adding pressure to a service that is already unhealthy. That is good, but it can still surprise you. Retries are one of those things most teams do not think about until an incident. Your code says call S3. The SDK says it'll handle some retries. Your app says, great, I'll pretend that that was one request.

Then the service starts throwing errors and suddenly request latency, thread usage, connection pools, client CPU, and downstream load all depend on retry behavior you may never have explicitly configured. Retries can save you from transient failures. Retries can also turn a partial outage into a client -side traffic storm wearing a helpful little hat. So the takeaway is simple.

Do not wait until November 2026 to discover how your app behaves. Pick a non -production workload. Opt in with the new environment flag. Look at latency. Look at error surfaces. Look at max attempts. Look at throttling behavior.

Look at long-polling clients like SQS consumers and figure out whether your app depends on old retry behavior without anyone realizing it because nothing says fun on call rotation like finding out your retry strategy was inherited from 2018 and load-tested by hope. Fifth story, let's talk about RabbitMQ, debug code, secrets, and cloud cost blast radius.

AWS published a security bulletin for CVE -2026 -9133 in the rabbitmq-aws plugin. The plugin resolves AWS ARNs in RabbitMQ's broker configuration at startup and can fetch things like TLS certificates, private keys, passwords, and other secrets from AWS services. The issue is that debug code in the plugin's ARN resolver was accidentally shipped in production builds.

A debug ARN scheme accepted by a validation endpoint could allow a remote authenticated user to read arbitrary files accessible to the RabbitMQ process. That is not good. AWS recommends upgrading to rabbitmq-aws 0 .2 .1, patching forked code, and rotating secrets stored in files. The RabbitMQ process could read. This is a specific bug, but the pattern is broad.

Debug code in production should make everyone briefly stop blinking because debug paths often bypass the normal shape of the system. They inspect the thing directly. They validate a thing in a way production code usually does not.

And then somehow that path makes it into a build where a real user or attacker can reach it this also pairs with a separate aws bedrock cost story from Reddit where a user described attackers using exposed access keys from an ec2 instance to run about $14,000 of Claude calls in 24 hours That second story is a Reddit report, so I would not treat it like a formal incident report, but as a pattern it is extremely believable cloud credentials plus AI services can become a very fast money fire.

Security and FinOps are blending together. Compromised cloud keys used to mostly mean crypto mining, data access, or infrastructure abuse. Now they can also mean someone burning through model inference or AI API calls at a rate that makes finance start typing in all caps. The takeaway is not complicated. Scope credentials. Use roles instead of long -lived access keys where possible. Watch unusual service usage.

Put budgets and anomaly detection around AI services. Rotate secrets when file-read issues appear. And remember that authenticated user does not mean safe user. Small bugs get expensive when the process can read secrets and the secrets can spend money. Now let's do a quick lightning round. First, OpenTelemetry graduated from the CNCF. This is a huge milestone.

OpenTelemetry is now basically the de facto standard for vendor -neutral telemetry across traces, metrics, and logs. But the operator warning is still the same. The collector is production plumbing. Graduation does not mean that every collector upgrade is safe, every processor config is harmless, or every telemetry pipeline is suddenly boring. Standardization helps, but you still need rollout strategy.

Config validation, load testing, and a plan for what happens when the thing that reports on production becomes the thing breaking production. Second, Claude Code had a security issue. I'm keeping this short because we have covered Claude code and agent security a lot lately. But the pattern matters. AI coding tools are not just editors. They can have filesystem access, repo context, terminals, deeplinks.

Commands, and workflow integration. So when those tools have parsing bugs, deeplink bugs, or command execution paths, the risk is not theoretical. The developer environment is becoming another agent runtime, and agent runtimes need threat models. Third, GitLab 19.0 introduced GitLab Secrets Manager in public beta. This is a good direction.

Secrets closer to the pipeline, scoped to jobs, governed through the same platform people already use for CI/CD, that does not solve every secret manager problem, but it does acknowledge reality. A lot of secrets risk lives in CI/CD because CI/CD is where systems need credentials to do work. Treating pipeline secrets as first -class objects is better than pretending a masked variable named prod token is a strategy.

Fourth, Google Cloud is rolling out hard spend caps for AI services. This is a FinOps story, but it is also a reliability story. If a budget cap pauses API traffic when spend hits a limit, that can protect you from a surprise bill. It can also become an availability event if your product depends on that API. So hard caps are useful, but they need operational design. Who gets alerted before the cap?

What degrades gracefully? What is customer facing? And what do you want more? A hard outage or a hard invoice? Sometimes the answer depends on the day. Fifth, Amazon Redshift Python driver had an RCE issue. AWS reported CVE -2026 -8838 in the Redshift Python driver, where a rogue server could execute commands on a user's data warehouse client.

That is a good reminder that database clients are part of your execution boundary too. Not every RCE starts on the server. Sometimes the client connects to the wrong thing, trusts the wrong response, and becomes the thing that gets owned. So patch the driver, watch connection targets, and remember that it is just a client library is usually how the story starts, not how it ends.

The human closer this week is about trusted tools the riskiest systems are not always the mysterious ones sometimes they are the familiar ones the extension everyone installs the workflow nobody reviews the retry behavior nobody configured the plugin that shipped with debug code the control plane api that seemed fine because the cache bought you an hour trusted tools become dangerous when trust turns into invisibility That does not mean that every tool is bad.

It means that trust should have an expiration date. Every so often you need to ask, what does this tool have access to? What can it change? What happens if it is compromised? What happens if it disappears? What happens if it retries differently? What happens if the cache expires? That is not paranoia. That is being the person who has to answer the incident channel when everyone else is asking, how could this happen?

The staff and principal engineer job is often about seeing the shape of the dependency. Noticing when a developer tool is actually a production path. When a retry default is actually outage behavior. When a multi -cloud architecture still has one hot dependency. When a plugin can read secrets. When the thing that everyone trusts has become the thing nobody questions. The takeaway is not to stop trusting tools.

You cannot run modern systems that way. The takeaway is to make trust visible. Map the permissions. Review the workflows. Scope the credentials. Test the failure path. Patch the clients. Constrain the plugins. And look at your boring dependencies like they might be production infrastructure. Because they probably are. That's it for this week of Ship It Weekly.

We covered the GitHub supply chain week with Nx Console and Megalodon. Railway's GCP account suspension outage. Discord's voice outage postmortem, AWS SDK retry behavior changes, the RabbitMQ AWS plugin file-read issue, and a lightning round on OpenTelemetry, Claude Code, GitLab Secrets Manager, Google AI Spend Caps, and Redshift Python Driver RCE.

If this episode was useful, follow or subscribe wherever you are watching or listening. If you're on YouTube, hit subscribe. If you are in a podcast app, Follow the show there. And if you know someone on a DevOps, SRE, platform security or engineering leadership team who is dealing with supply chain risk, cloud dependencies, retries or trusted tooling, send this one to them.

It helps the show grow and it helps me keep making this kind of content for people who actually live with these systems. You can find the weekly brief at OnCallBrief.com and more episodes and this week's show notes on ShipItWeekly .fm. I'm Brian Teller from Teller's Tech. Thanks for listening.

And remember, if your trusted tool can install code, trigger CI, route traffic, retry requests, read secrets, or burn cloud money, it is not just a tool anymore. It is part of production. So maybe treat it like it.

Scroll inside the box to read the full transcript.

This page is for you if…

  • You prefer reading or searching over listening
  • You need a quote or link to share with your team
  • You are indexing operational guidance from a specific episode
  • You want to preview an episode before committing listen time
Scroll to Top